How to Read a Histogram in 2 Minutes
 by Marco Carotenuto · · 11 min read
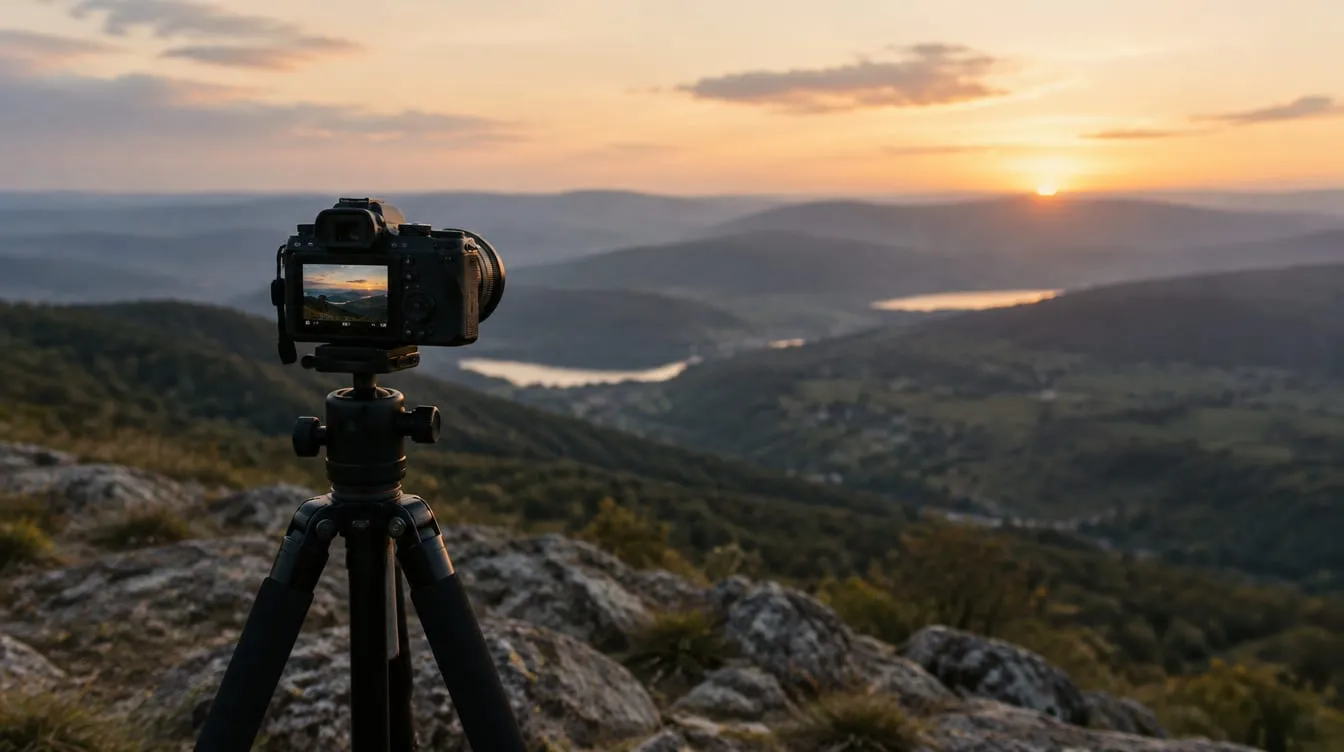
You check the shot on the camera screen and it looks right. At the computer it is darker than you thought, or the sky is white with no detail. The screen on the back of the camera misleads you because its brightness depends on where you are standing. The histogram does not: it is a graph built from numbers, and it shows what the sensor actually recorded.
This guide teaches you to read a histogram in photography with three checks that take about two minutes: edges, position and width. You will see when a spike is a mistake and when it is intended, where the sources disagree, what to change on the camera, and an exercise you can do at home.
What is a histogram and what does it show?
It is a graph that counts the pixels in your photo by brightness. The horizontal axis runs from pure black on the left to pure white on the right; the vertical axis shows how many pixels sit at each level. Photography Life and B&H describe it the same way.
Split the axis into three zones: shadows on the left, midtones in the middle, highlights on the right. The graph looks like a mountain range, and according to B&H the height of the peaks matters little: what matters is how far the range extends to each side.
An extreme case makes it easy to remember. Shoot with the lens cap on and every pixel is black, so the histogram is a single bar against the left edge. B&H gives the opposite example: a long exposure on a sunny day puts the spike on the right.
How do you read a histogram in three checks?
Check edges, position, width, in that order. The method is ours, and its purpose is to keep you from being distracted by the overall shape, which tells you little by itself. Each check answers a question and leads to a decision:
| Check | What you look at | What it tells you | What you do |
|---|---|---|---|
| 1. Edges | Does the graph touch the left or right edge? | If so, detail is lost in that zone (clipping) | Decide whether that zone matters; if it does, adjust exposure |
| 2. Position | Where does most of the tonal weight sit? | Whether the photo is, on average, dark, medium or bright | Ask yourself whether the scene really was like that |
| 3. Width | Does the graph fill the axis or stay narrow? | The scene’s contrast | If narrow, remember that contrast can be added later |
These are three questions, not three rules. Check 2 in particular has no universally right answer: it depends on what you were photographing. The sections below take each check in turn.
What does it mean when the graph touches an edge?
It means part of the image was recorded as pure black or pure white, with no detail. This is called clipping: Photography Life describes it as the loss of detail that happens when the graph “touches” a side. On the right it is blown highlights, on the left crushed shadows.
It is not always a mistake. It depends on what is losing detail:
- The sun in the frame, reflections on water or metal, light bulbs: it is natural for them to be white. Cambridge in Colour also says some clipping is fine in these cases.
- A silhouette or a deep shadow you want black: the spike on the left is your intention, not a flaw.
- Clouds, snow, a white dress, a face: here the detail matters, and a spike on the right is a problem.
The sources are not fully aligned here either. JuzaPhoto says the graph should not touch the edges even with very bright or very dark subjects, yet it accepts a black silhouette touching the left edge. B&H and Cambridge in Colour are blunter: what matters is that clipping is a choice, not an accident. The second reading works better in the field: look at where the spike falls in the picture and decide whether you need detail there.
The two sides do not weigh the same. According to Cambridge in Colour, detail cannot be recovered once an area turns solid white, while underexposure is usually more forgiving, although it worsens the signal-to-noise ratio. That is why important highlights deserve more care than shadows.
Where should most of the tones sit?
Where the scene sits. A dark photo has its graph on the left, a bright one on the right, and neither is wrong. If most pixels are on the left and the scene was a starry night, the exposure is correct. If it was a snowfield at noon, the photo is underexposed.
The principle is that the camera measures reflected light and tends to pull the image’s average toward the midtones, as Cambridge in Colour explains: that works for average scenes and fails for very bright or very dark ones. For when and why this happens, remember gray snow, which is covered in snow photography.
A quick check each time you look at the graph: was the scene bright, medium or dark? And does the shape say the same?
| Scene | Expected shape | If you see this instead… |
|---|---|---|
| Snow or sand in full daylight | Most tones on the right | A central hump: the photo is probably gray |
| Night, dark interior, dark subject on dark background | Tones on the left | A central hump: the photo is probably too bright |
| Ordinary landscape in even light | Central hump tapering to the sides | Spikes at the edges: see where they fall in the picture |
| Backlit scene with a bright sky | Shadows on the left, sky on the right | Everything on the left: did the sky fall into darkness? |
The table lists expected shapes, not mandatory ones. The idea that the “right” histogram is a hump in the middle is a myth, and Photography Life puts it bluntly: there is no “good” or “bad” histogram in itself. In high-key or low-key work the scene has a different distribution, and so should the graph.
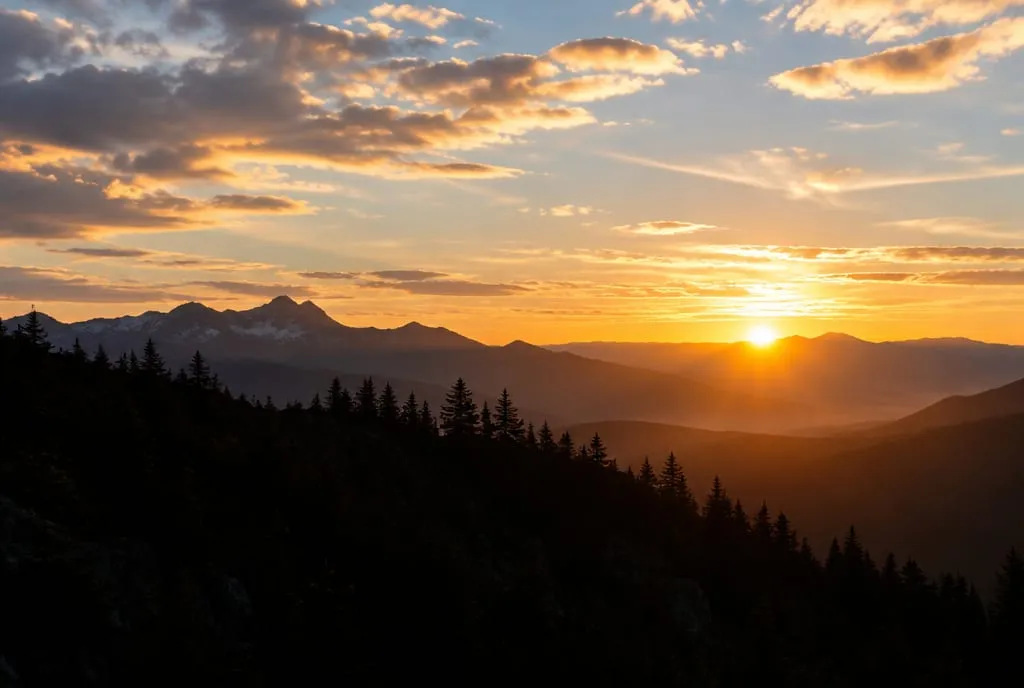 A scene with a large almost-black area and a bright sky: the tones are spread from one end of the histogram to the other, and a spike against the left edge for the ridge can be intended. Image generated to illustrate the concept; it is not a photo of a real place.
What does the width of the graph tell you?
It tells you how much contrast the scene has. A graph that fills the whole axis means a contrasty scene with deep shadows and strong highlights; a narrow, bunched one means low contrast. Cambridge in Colour uses fog as the example of a narrow histogram, as opposed to strong daylight.
A narrow graph with empty space on both sides does not mean the exposure is wrong. It happens with fog, open shade or very soft light, and the photo can look veiled or flat. JuzaPhoto explains that in these cases you cannot improve the shot at the camera: contrast is added afterward by moving the black point and the white point toward the ends of the graph.
This helps you tell apart two problems that look alike by eye:
- Flat photo with a narrow graph: exposure is correct and the scene has little contrast. If that is not what you want, work on contrast in editing or change the light.
- Flat photo with a wide graph and shifted tones: there is probably an exposure or haze problem, solved elsewhere.
To see how much light drives these choices, read hard vs soft light and fog photography. If your photo is correct on paper but still feels dull, the cause is often not exposure: it is explained in why your photos look flat.
How do you fix exposure after reading the histogram?
Move the graph in the direction you need, using exposure compensation or the manual controls. Photography Life suggests positive values such as +0.3 or +0.7 to save shadows, and negative values such as -0.3 or -0.7 to save highlights. Then shoot again and look at the graph again.
The logic is always the same: one change, one shot, one check.
| What you see | What to do | How |
|---|---|---|
| Spike on the right edge in an area you need | Darken the exposure | Negative compensation, or a shorter shutter time or a smaller aperture |
| Spike on the left edge in an area you need | Brighten the exposure | Positive compensation, or a longer shutter time or a wider aperture |
| Graph all on the left, bright scene | Brighten | Positive compensation (typical of snow and sand) |
| Graph all on the right, dark scene | Darken | Negative compensation |
| Highlights and shadows touch both edges | One shot is not enough | Choose what to protect, or shoot several exposures |
In the last row the scene has more contrast than the sensor can record: no single setting solves everything. For what to protect, and how shutter speed, aperture and ISO trade off against each other, see the exposure triangle. On our photo tours we often see beginners over-correct with the histogram: one small move followed by a new shot teaches more than three big corrections.
When do you need the RGB histogram and highlight warnings?
When colors are very saturated, or when you want to know where the clipping falls. The RGB histogram shows the three channels separately. According to B&H, a channel can be clipped even when the brightness histogram shows nothing, and that “hidden” clipping can matter a lot for your picture.
Highlight warnings (the “zebras” or the blinking on blown areas) do something different from the histogram. The graph tells you how much is clipped; the warnings show you where. B&H recommends using them together: the graph for the amount, the blinking to see whether the area matters. A blinking sun is fine, a blinking face is not.
One caveat applies to both. As B&H notes, the histogram and the warnings are usually based on a JPEG preview, even when you shoot RAW. The RAW has a little more headroom, so a spike on the right edge is often recoverable, but you cannot be sure from the display. For highlights that matter, leave a small gap from the edge.
Where to find the histogram varies by camera. Photography Life notes that in playback it is switched on with the navigation keys (on some Nikons with an up or down press), and that many DSLRs show a live histogram, but only in Live View. When in doubt, look in the manual under “histogram” or “display information”.
Is it worth pushing the graph to the right?
It depends on what you are after, and the sources say different things. JuzaPhoto describes as ideal the brightest exposure that does not blow the highlights: darkened later in editing, it says, the photo has less noise and more dynamic range. Photography Life, on the other hand, uses the histogram mainly to avoid losing detail and denies that any graph is “good” in absolute terms.
The most prudent approach is not to change habits on principle but to test it on your camera. Shoot the same scene once with the graph a little further right without touching the edge, and once more centered, then brighten or darken in editing to match and compare the noise in the shadows. If you cannot see a difference, there is no need to chase one.
What to do next
A home exercise, about twenty minutes, to connect what you see in the graph with what you see in the image. You need a camera, a sheet of white paper, a black cloth or card, and window light.
- Turn on the histogram on the display, in playback. If your camera has an RGB histogram, start with the brightness graph.
- Photograph the white sheet so it fills the frame, in an auto mode (for example aperture priority), with no compensation. See where the graph sits and how the white looks on the display.
- Repeat at +1, then +2 compensation. After each shot, watch whether the graph moves right and when it reaches the edge. Note the value at which the white looks white without a spike on the edge.
- Do the same with the black cloth, using negative compensation, and see when the black stops looking gray.
- Photograph the same indoor scene (a window with a curtain, for example) at three compensations: -1, 0 and +1. For each, check the edges, the position and the width. Write one sentence saying which you prefer and why.
By the end you will have seen for yourself that the camera aims for the middle, and that the histogram tells you before the computer does. If you then want a second opinion on a shot you already took, upload it to Framia: the technique score tells you what works in the exposure and what does not, so you can connect the graph to what you see. For how technique fits into the overall judgment, read how to tell if a photo is good.
FAQ
Is there such a thing as a perfect histogram?
No. Photography Life, B&H and Cambridge in Colour agree: the right shape depends on the scene and on what you want. A backlit sunset, a night shot and a deliberately bright high-key portrait all produce very different histograms, and all can be correct. What matters is that the shape fits the subject and that you know why it touches an edge, if it does.
Can I trust the camera histogram if I shoot RAW?
With one caution. According to B&H the histogram and the highlight warnings are usually based on a JPEG preview, while the RAW file has a little more headroom. So a spike just touching the right edge is often still recoverable in the RAW, but you cannot be sure from the display alone. For highlights that matter, leave a small gap from the edge.
Why does the histogram look fine but part of the picture is blown out?
It can happen with strongly colored subjects. The brightness histogram combines the channels, while a red sky or a saturated flower can clip a single channel (red, green or blue) without the overall brightness showing it. If your camera offers an RGB histogram, use it when colors are intense.
Isn't the camera screen enough to judge exposure?
It is a useful preview for composition and sharpness, but the brightness you see depends on the screen's backlight and the light around you: it looks darker in sun and brighter in the dark. The histogram does not change with your surroundings, which is why you use it alongside the image rather than instead of it.
Should I always push the histogram to the right?
It is a choice, not a rule. JuzaPhoto recommends exposing as bright as you can without clipping highlights, because a shot darkened later in editing has less noise. Photography Life treats the histogram mainly as a guard against lost detail, not as a target. How much it helps depends on the camera, and the way to find out is to test yours.